
What do People Spend Their Money On?
 Country of residence, age, and income are among the major indicators of a person’s spending pattern. It is interesting to note that different countries have different priorities in terms of household spending. Although housing, food, and transportation tend to be the top three major categories when it comes to budget allocation, it is interesting to note how it varies from one individual to another.
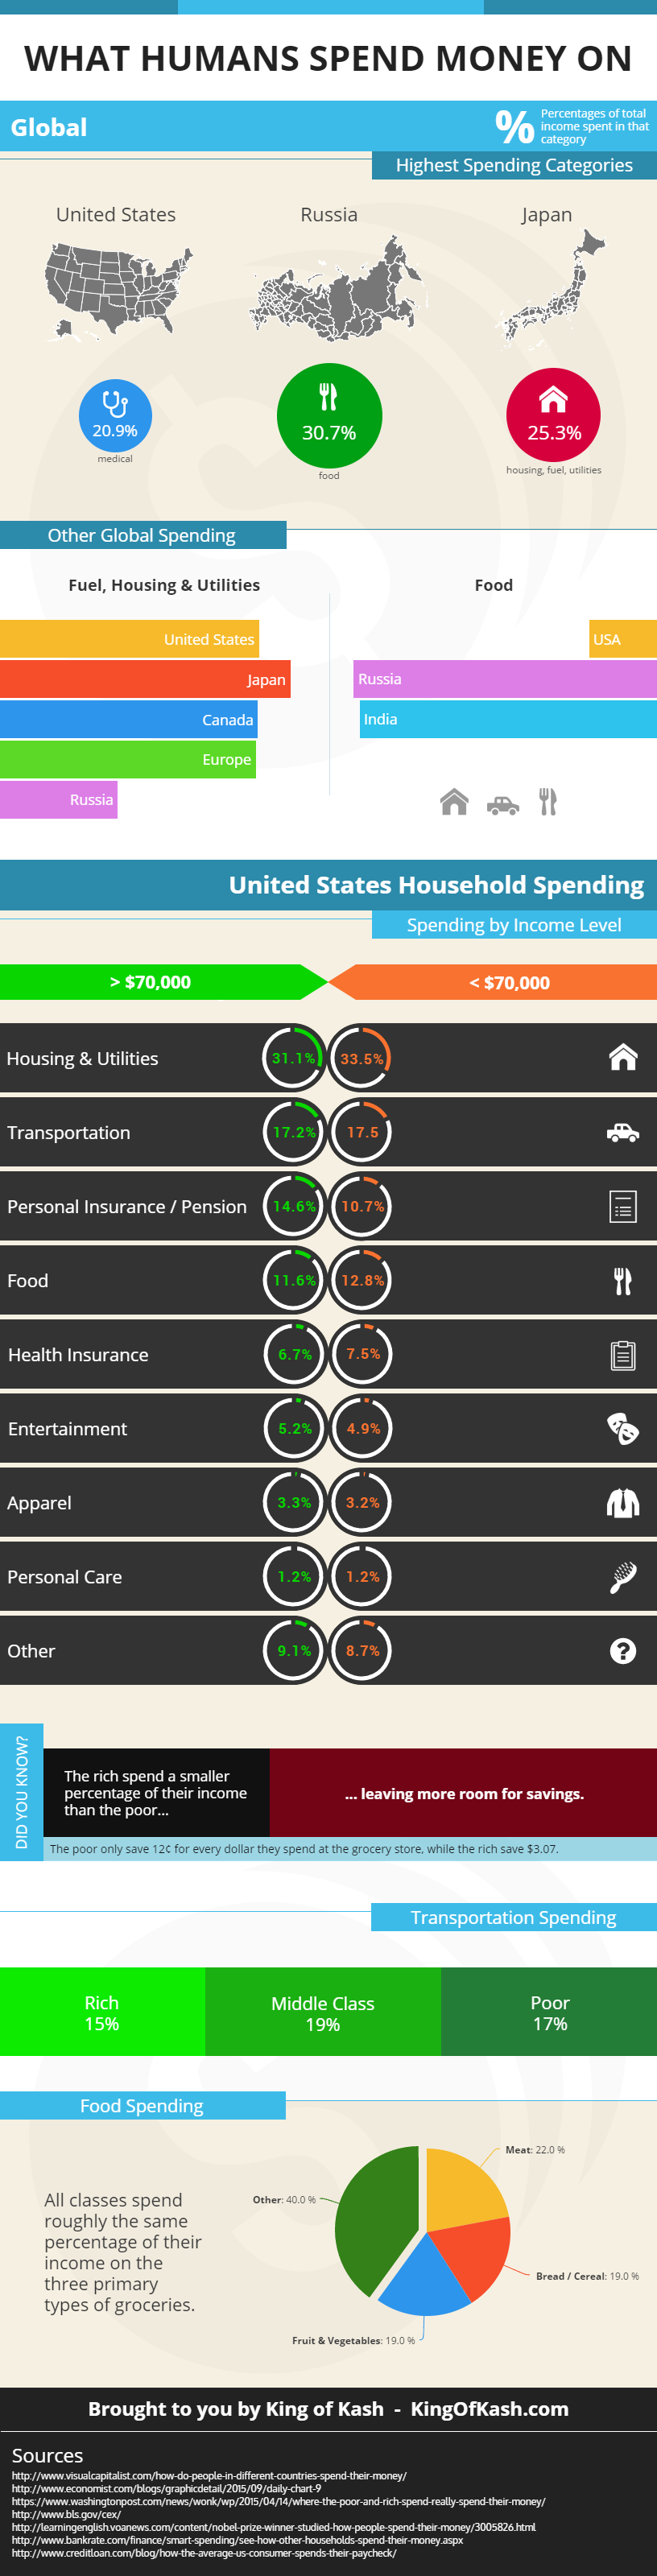
On a bigger scale, data shows spending patterns vary per country as well. For instance, data from The Economist shows that Japan spends a lot of money on housing, fuel, and utilities with 25.3% allocation. Russia, on the other hand, allot 30.7% of their budget on food. While in the United States, it appears that people spend more money on their health with 20.9% allocation.
How People from Different Parts of the World Allocate Money
Developed Countries
The interesting part about these numbers is that they inadvertently reveal aspects about the economic and cultural state of a country. For example, developed countries such as the United States, Japan, Canada, and the European Union are shown to spend about 20 – 25% of their household spending on fuel, housing, and utilities.
However, for Russia only 10.3% is allocated on housing primarily due to the fact that housing is subsidized. Opposite to the United States that spend only 6.8% on food, Russians are shown to spend 30.7% of their budget on food and 8.3% on alcohol and tobacco.
Less Developed Countries
In contrast, less developed countries like India where GDP is far lower, tend to focus their budget more on basic necessities such as food (30%). Indians also tend to spend less on recreation with only 1.5% and restaurants with 2.6%.
Clearly, there is a correlation between what people find worth spending their hard-earned money on and the economic state of a country. This means the financial capacity is a big indicator when it comes to an individual’s spending habits.
Spending Habits by Income Level
An article written by Max Ehrenfreund for Washington Post revealed that lawmakers in several states in the US are urging limits on how welfare recipients use public benefits. Data from ten equally sized classes of US household sorted by income from the Bureau of Labor Statistics shows fascinating detail.
The categories involved in the study are housing, transportation, pension, life insurance, and food. Unsurprisingly, the rich spend more in almost all categories. However, based on the percentage of their total incomes, which are larger, the rich are shown to be spending less compared to the poor.
Another interesting figure from the data shows how the middle class spend more on transportation compared to the rich and the destitute who prefer to either go on a bike or walk. According to the data, middle class Americans spend about 19% of their money on transportation where the destitute use about 17% and the rich about 15%.
Food is the only category that shows no variation regardless of income. Americans from different social class are shown to make similar choices at the grocery store. However, Americans, regardless of financial status, spend about 19% of their grocery budget on fruit and vegetables, 22% on meat, and 13% on bread and cereal.
Saving Habits by Income Level
Data also shows the biggest difference between the rich and the poor is not on how they spend their money, it is on how they save it. For every dollar spent in grocery shopping, the poorest households get to save only 12 cents, while the wealthy keep about $3.07 for life insurance and pension.
For obvious reasons, economists are pointing out the rising levels of inequality in America. The rich get to save more and it follows that the more excess income they have, the more they’ll save. In a lethargic economy, what this means is that there are fewer businesses that thrive and as a result, fewer jobs. The money that is being saved does not go back to circulation, which means less work for the cleaner and slower business for the owner of a five-star hotel.
Spending, Well-being, and Poverty
Professor Angus Deaton of Princeton University in New Jersey won the 2015 Nobel Prize in Economic Sciences for his study on how people spend their money. According to the Nobel committee, Professor Deaton’s study dealt with three questions: How do consumers spend and allocate their money on different goods? How much of society’s wealth is saved and spent? And how do we best measure and study well-being and poverty?
Deaton’s study showed the relationship between poverty and the amount of calories in the food people ate. When asked why he paid so much detail on household information, the professor said it goes down to understanding people and their behavior. Just by checking the household data, we can shed light on the relationship between income and calorie intake and its more obvious effects such as gender discrimination within the family.
Learning how other people spend their money puts things in perspective for the regular household. It gives a reality check, which helps people reconsider and craft a more realistic budget.
Spending Habits by Household
An annual report by the Bureau of Labor and Statistics breaks down various expenses in the common household. According to this Consumer Expenditure Survey, most household income goes to housing, which takes about 33.5% ($17,377) for regular households and 31.1% ($29,954) for households earning more than $70,000 a year. Transportation comes second with 17.2% ($14,908) for households earning more than $70,000 a year and 17.5% ($9,104) for regular households.
Consistent to the statement earlier about how the rich have more money saved on personal insurance and pensions, data shows that households earning more than $70,000 a year save more than they spend on food. Third on the spending list for households with more $70,000 income a year is personal insurance and pensions with 14.6% ($12,614) followed by food with 11.6% ($10,084). Regular households, on the other hand, spend more on food with 12.8% ($6,665) compared to only 10.7% ($5,551) spent on personal insurance and pensions.
Other categories on the list include health care including health insurance with 6.7% ($5,797), entertainment with 5.2% ($4,524), apparel with 3.3% ($2,860), and personal care with 12% (997) for households with more than $70,000 income per year. General households, on the other hand, spend 7.5% ($3,919) on health care, 4.9% ($2,560) on entertainment, 3.2% ($1,674) on apparel, and 1.2% ($602) on personal care.
How to Use This Data
According to financial planners, these statistics help start conversations about goals, dreams, and values. The figures don’t lie. They reflect priorities and what people consider to be valuable. This is why taking a close look at where the money is going helps put things in perspective.
For individuals who wish to put their financial lives in order, listing down where the money goes is a good start. Consider which aspects of your life are taking most of your money. Perhaps redefining what you consider is of value may come out of this exercise. Knowing your financial state is in order will help you feel more confident and relaxed about the future. On a bigger scale, understanding how people spend their money helps predict economic health. This helps us re-evaluate our values as a society and keep our morals in check.

Cary Silverman is a consummate entrepreneur having sold multiple companies during his 20 years of business experience in the financial industry, but for him, it isn’t about the money. His success is rooted in his passion to focus on doing something better today than it was done yesterday. These days, he’s the CEO of Waldo General, Inc. that oversees the operation of King of Kash.